 By Michael McCann
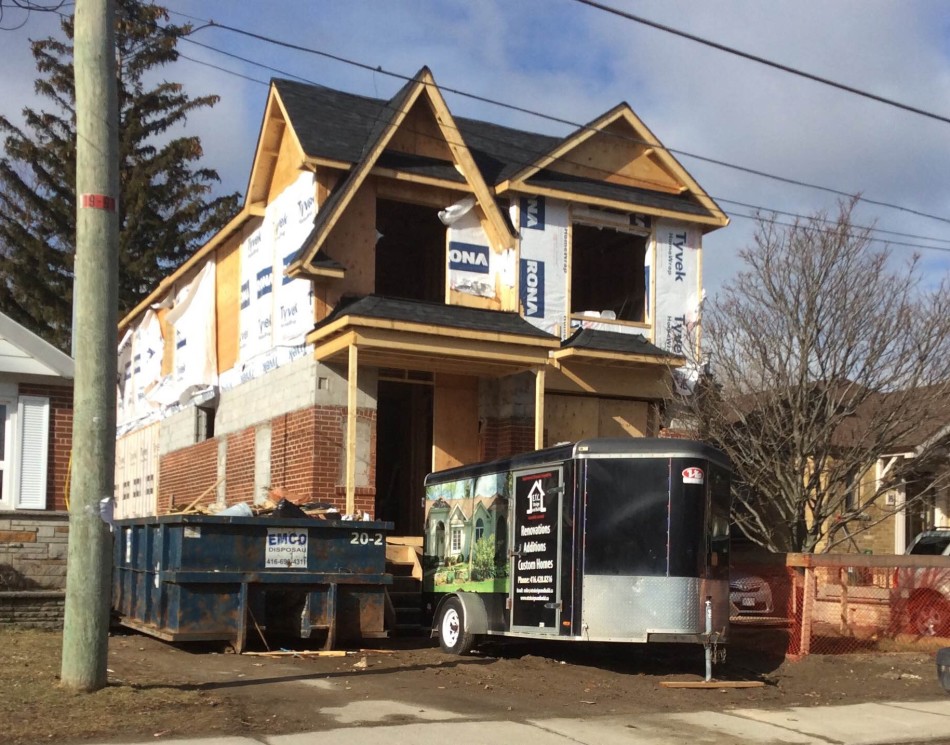
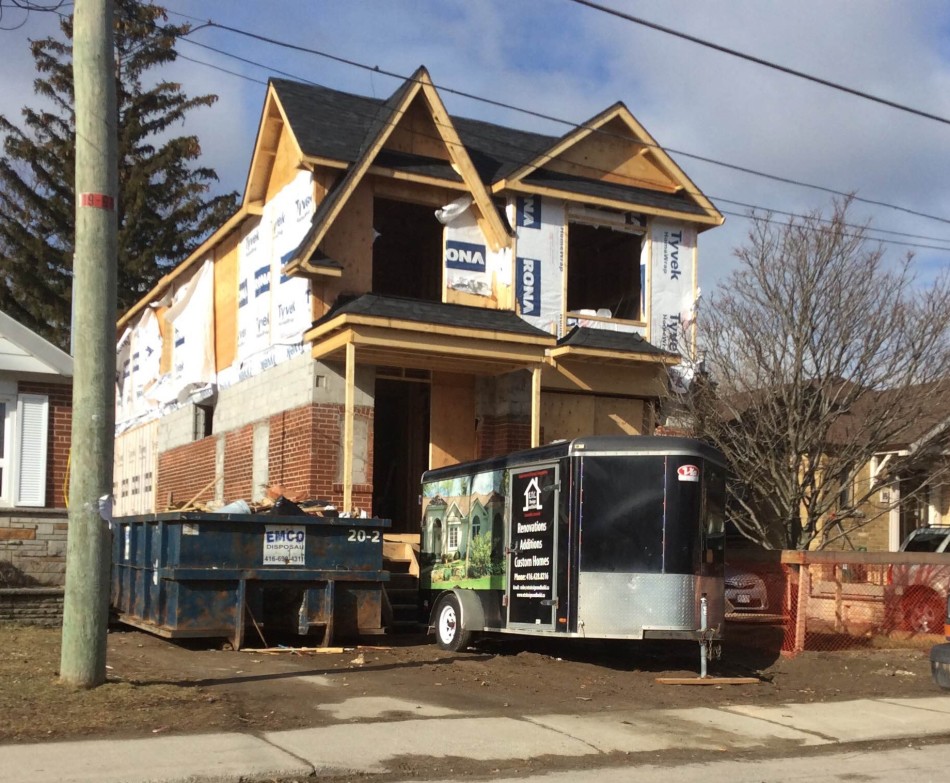
Fall is traditionally the second busiest period for house sales with the spring market always being the most active.
Buyers came back strong after taking a summer break from house hunting.
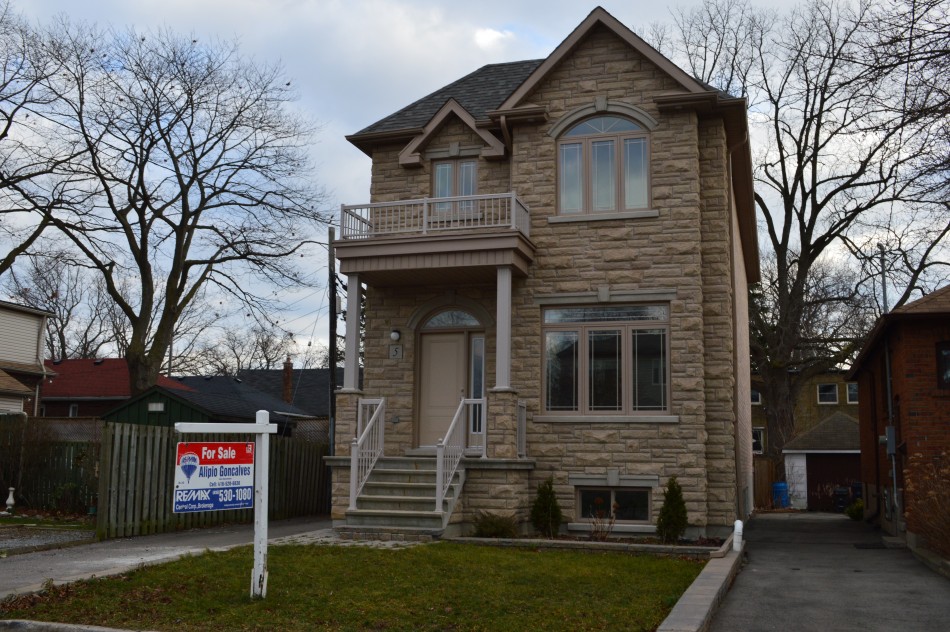
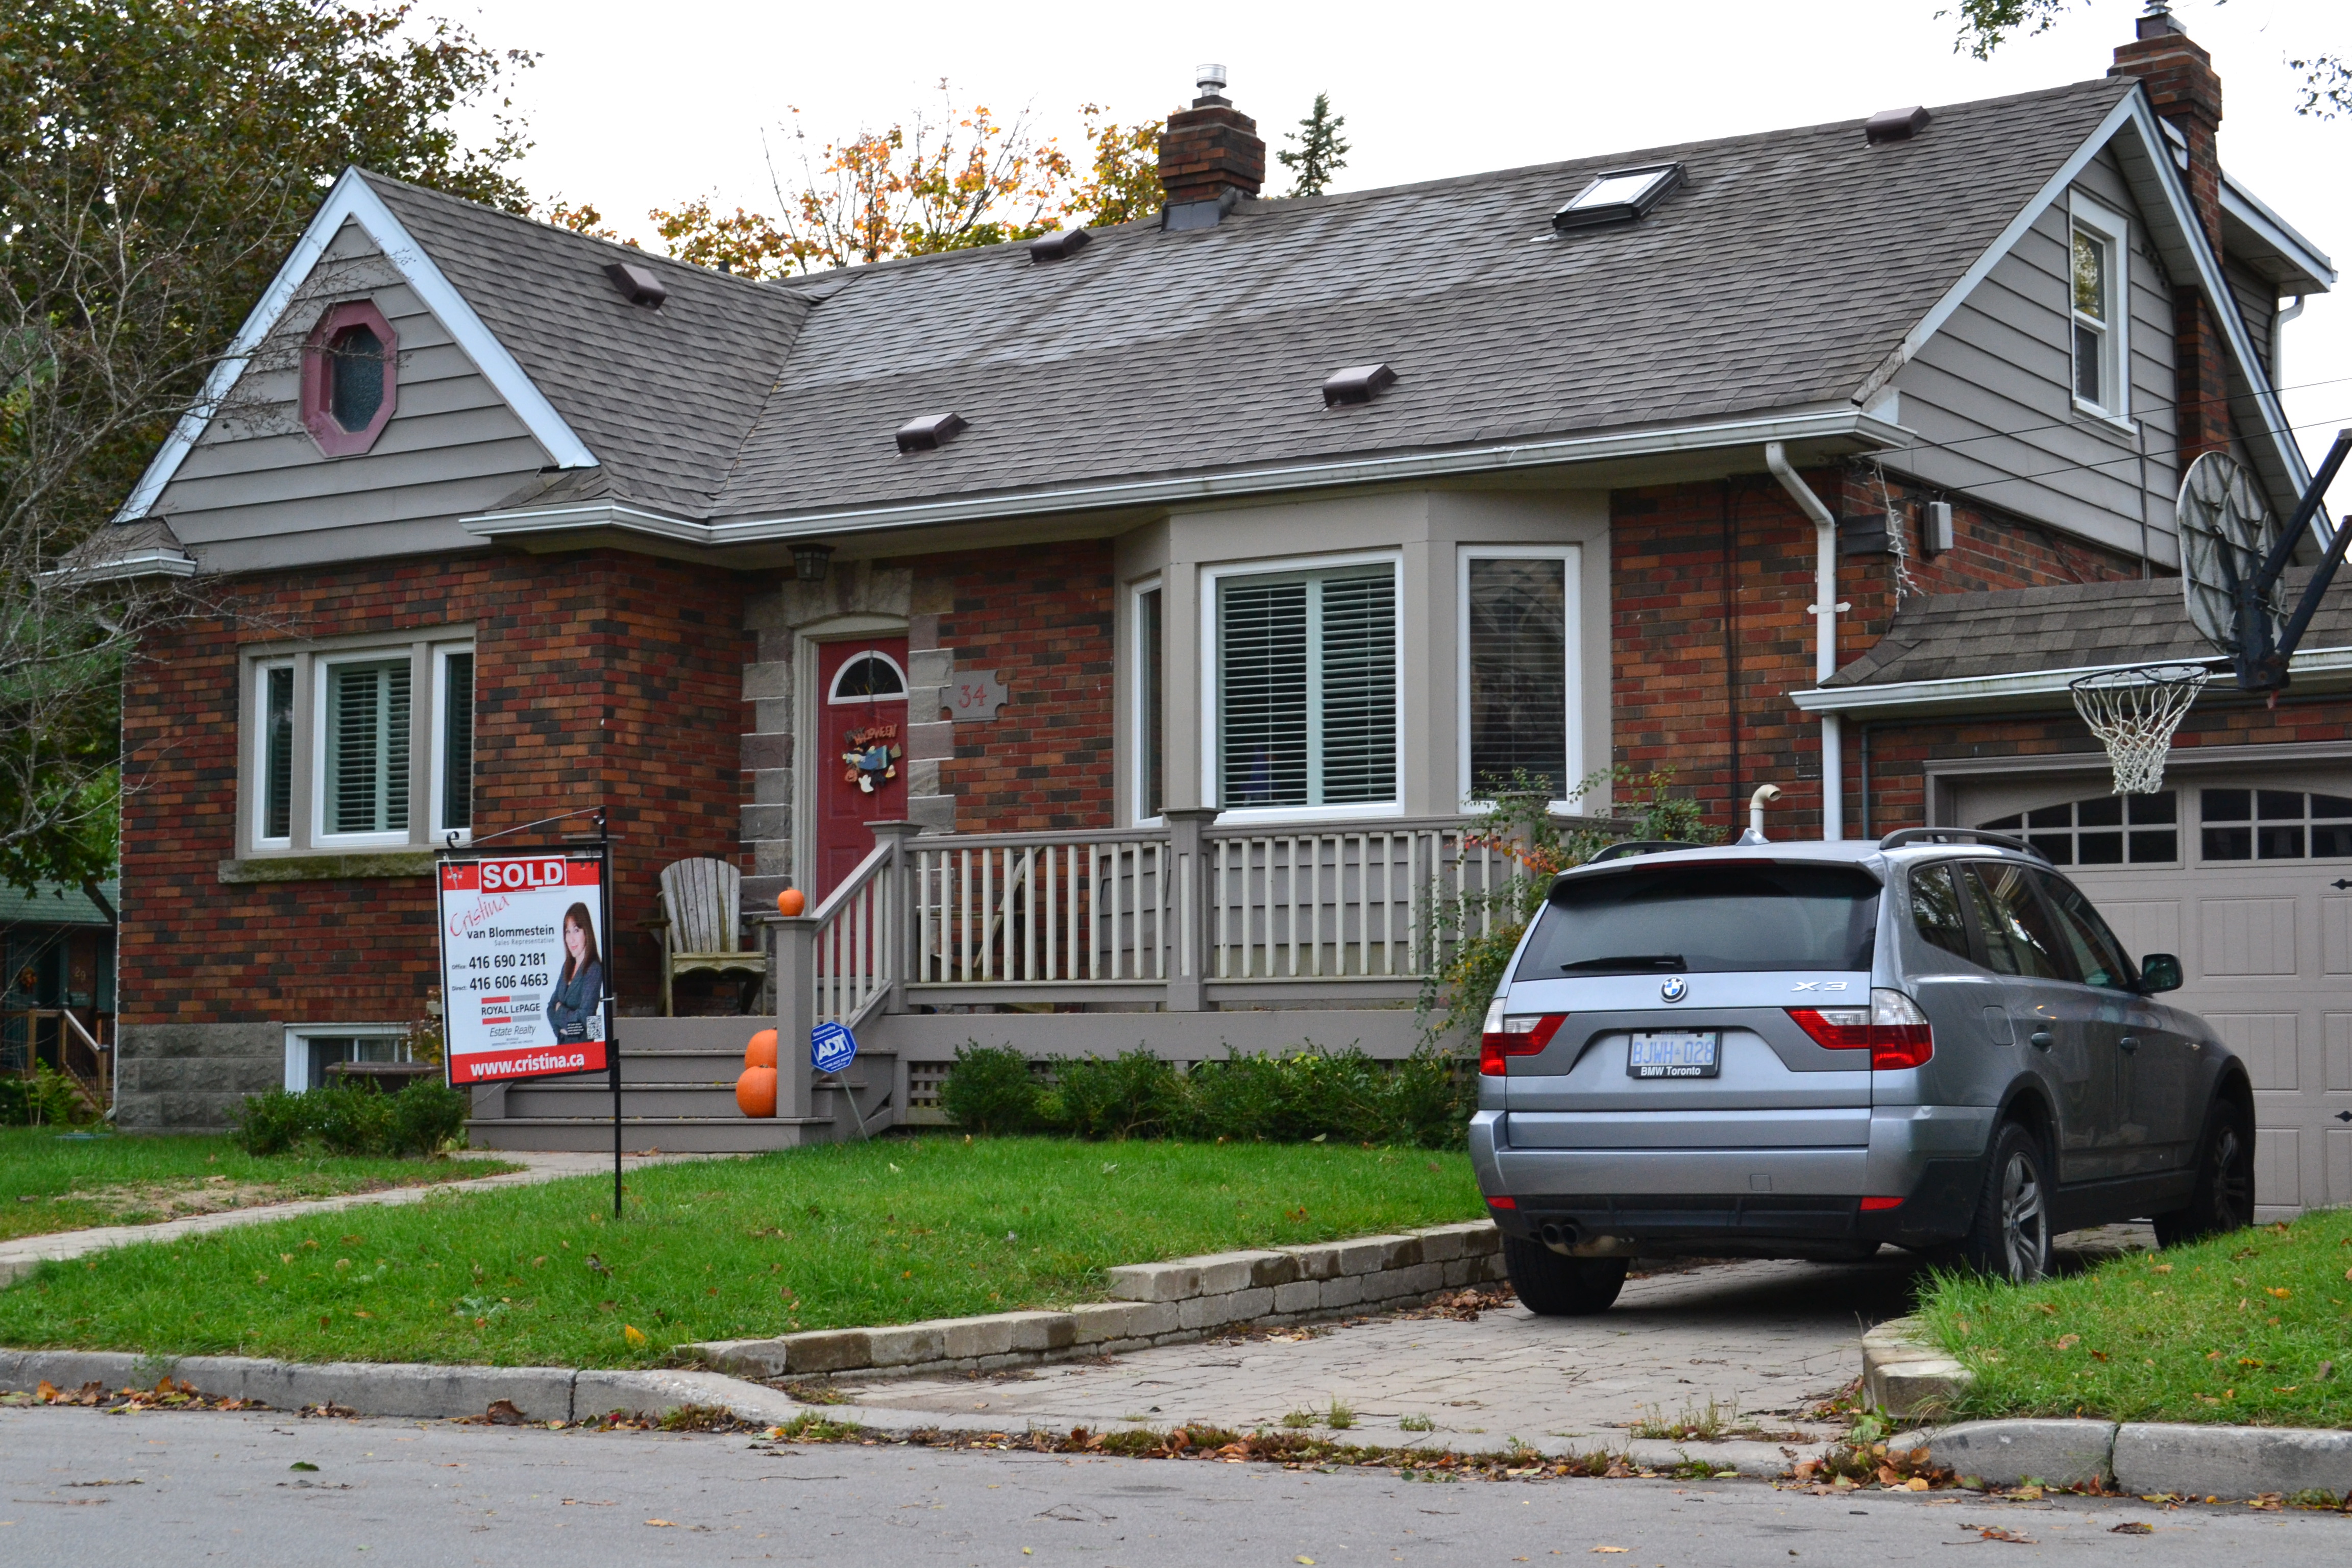
Those of our neighbours selling who priced homes at market value experienced a quick sale and in some cases attracted multiple offers.
I would expect to see continued robust sales for the month of October with numbers similar with those experienced in September.
Buyers are looking to close a deal before winter, therefore will actively looking to buy while the warm fall weather holds.
But now the numbers for the past month:
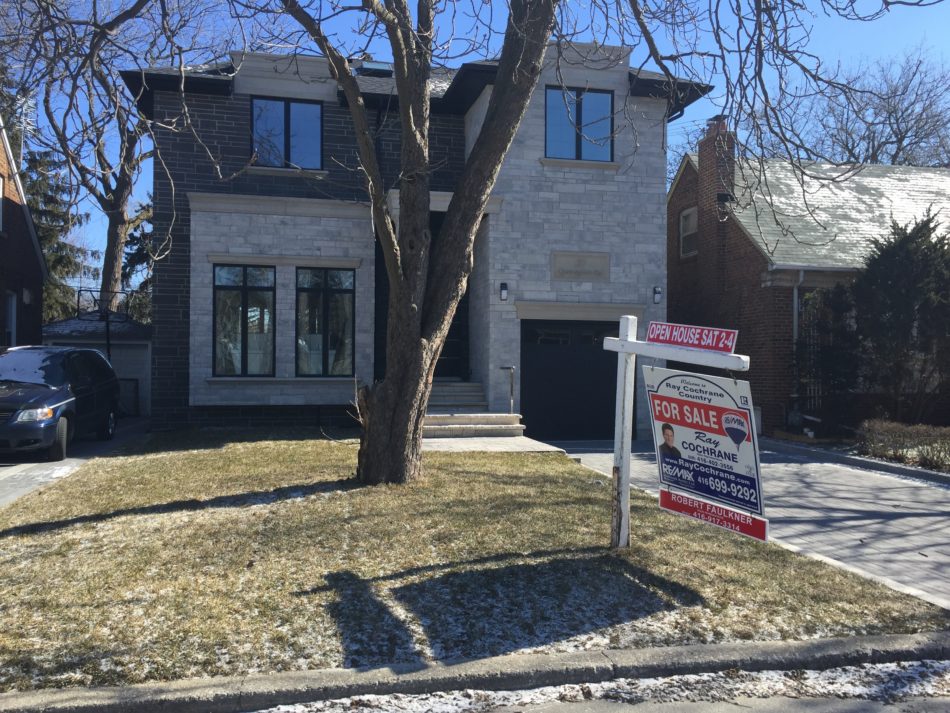
Birch Cliff – Cliffside Home Sales in September 2013 – 28 homes sold
Source: Toronto Real Estate Board all sold homes excludes commercial properties, condos and vacant land
Birchcliff/Cliffside
- September 2012 we had 19 homes sold while September of this year 28 homes changed hands – a 47% increase
- September of 2012 the average sold price was $529,132 while September 2013 the average sold price came in at $581,375 – an increase of 10%
- September 2012 it took on average 12 days and in September 2013 it took 16 days to sell a home.
Toronto Real Estate Board
- 7,411 sales in September 2012 with September 2013 showing 5,687 sales – Up by 30%
- $501,326 average selling price September 2012 with September 2013 coming in at $533,797 – Up by 6.5%
- September 2012 it took an average of 29 days to sell a home where September of this year 27 days
Canadian Real Estate Association
- September 2013 home sales were up by 18.2% from September of 2012
- The national average home sale price was up 8.8% year over year based in September
Our local house sales are certainly reflecting what is occurring across both in the GTA and nationally with increased sales and a rise in property values. We are certainly in the envious position of living in a desired community which I perceive will continue for years with increased house prices.
For a look at local real estate prices over the last six months, click on the tabs.
[tabs slidertype=”top tabs”] [tabcontainer] [tabtext]August[/tabtext] [tabtext]July[/tabtext] [tabtext]June[/tabtext] [tabtext]May[/tabtext] [tabtext]April[/tabtext] [tabtext]March[/tabtext] [/tabcontainer] [tabcontent] [tab]Birchcliff – Cliffside Home Sales in August 2013 – 28 homes sold [/tab] [tab]Birchcliff – Cliffside Home Sales in July 2013 – 25 homes sold [/tab] [tab]Birchcliff – Cliffside Home Sales in June 2013 – 22 homes sold [/tab] [tab]Birchcliff – Cliffside Home Sales in May 2013 – 46 homes sold [/tab] [tab]Birchcliff – Cliffside Home Sales in April 2013 – 45 homes sold [/tab] [tab]Birchcliff – Cliffside Home Sales in March 2013 – 36 homes sold [/tab] [/tabcontent] [/tabs]
According to the Toronto Real Estate Board, our local housing market is defined as Birch Cliff/Cliffside and the boundaries can be seen below.
View Birch Cliff / Cliffside in a larger map