 By Michael McCann
Birchcliff’s housing market continues its momentum unabated.
Before we get into the December housing statistics, however, I thought this would be an excellent opportunity to look back over the last five years of our neighbourhood housing sales.
No one can predict what the future holds, but by analyzing past sales we can certainly get an indication of emerging market patterns.
What I have done is create a statistical snapshot of the monthly Birchcliff housing sales from the years 2010 – 2014 that allows you to see monthly average selling prices and how this metric compares year over year.
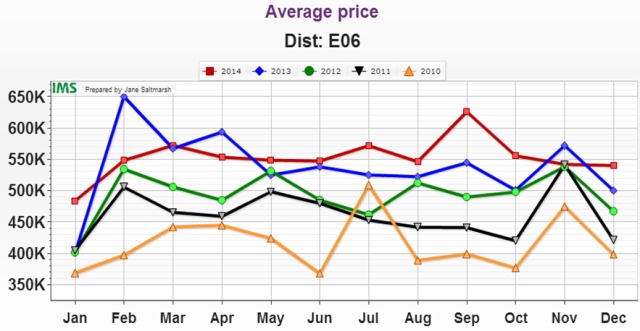
The overall monthly house prices, compared year over year, show strong increases.
Looking at this you can easily get lost, however if you study it carefully you can see the undulating pulse of our housing market.
What it illustrates are the months that garner the best prices as well those months getting lower prices. (There are always some individual factors that impact our housing sales, but those anomalies are unique for that specific month. One of those anomalies could be a specific month where multiple higher priced homes sold.)
Historically the spring and early fall months tend to be the months that attract the highest selling prices, while the colder months of December and January see more modest gains.
When do homes sell quickest?
Below is a graph showing the average monthly days on market and you can get an idea of when is the best time to sell a home – the best time is the shortest monthly period.
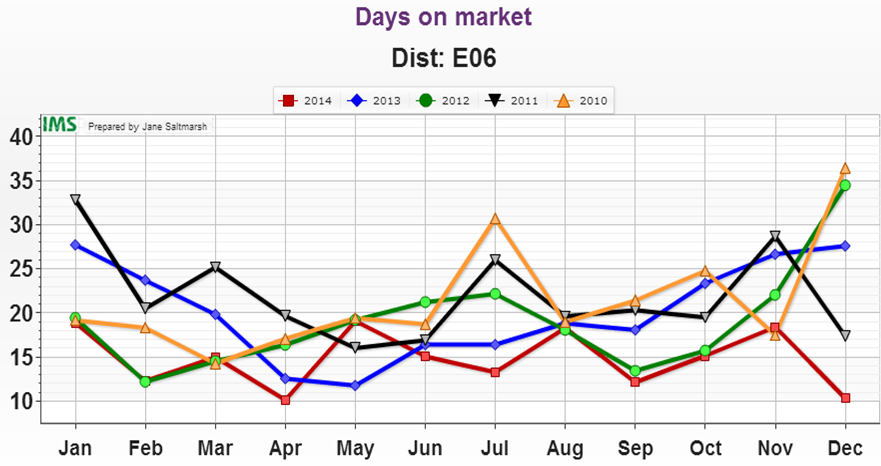
Here, the longest time it took to sell a home was in January and July while the shortest time on market was February, March, April and September.
Birchcliff – Cliffside Home Sales in December 2014 – 8 homes sold
Birchcliff/Cliffside
- Only 8 homes changed hands in December 2014 compared to 17 in December 2013 – a 47% decrease in sold homes
- December of 2014 the average sold price was $661,550 while in December 2013 it was $541,441 – an increase of 20%
- December 2013 it took on average 31 days to sell a home and December 2014 it took 13 days – this would be even less if sellers had not delayed offer review dates
Toronto Real Estate Board
- 4,058 sales in December 2013 with December 2014 showing 4,446 sales – Up by 9.6%
- $520,189 average selling price December 2013 with December 2014 coming in at $556,602 – Up 7%
- December 2013 it took an average of 33 days to sell a home where December of this year 32 days
What lies ahead?
What’s in store for Birchcliff in the next couple of months?
I will sound repetitive, but with so few homes available for sale we will continue to see a strong seller’s housing market.
It’s a basic supply and demand economic model. Buyers are actively searching but low housing inventory is pushing home prices up. This is all predicated on pricing a home at market value and ensuring the house appeals to their specific buyer demographic.
Just we are experiencing some extremely cold temperatures, the outlook for our neighbourhood housing market is in one word HOT!