 By Michael McCann
With the holidays and the hydro blackout it was certainly a busy and difficult time for most of us living in Birchcliff.
Considering the situation, real estate sales were the least of our concerns as we struggled for days with dark homes and plunging temperatures, amended Christmas plans and made alternative living accommodations.
As a result, we decided to double up this month to include real estate analysis for both November and December.
November
In November you would normally see home buyers defer any housing decision to the new year, but I have to say many of my buyers did not let up on their housing search.
What I am finding are buyers who were unsuccessful in getting a deal in the fall are unrelenting in their quest for a home.
What’s happening this year is that we are short of listings.
If you compare the number of active homes for sale in November of this year versus last year we see a deficit of 12.1%.
That shortfall is significant and it was not just last month – the trend of less available housing inventory was the story for the entire fall market.
The reality was that buyers had fewer houses to look at.
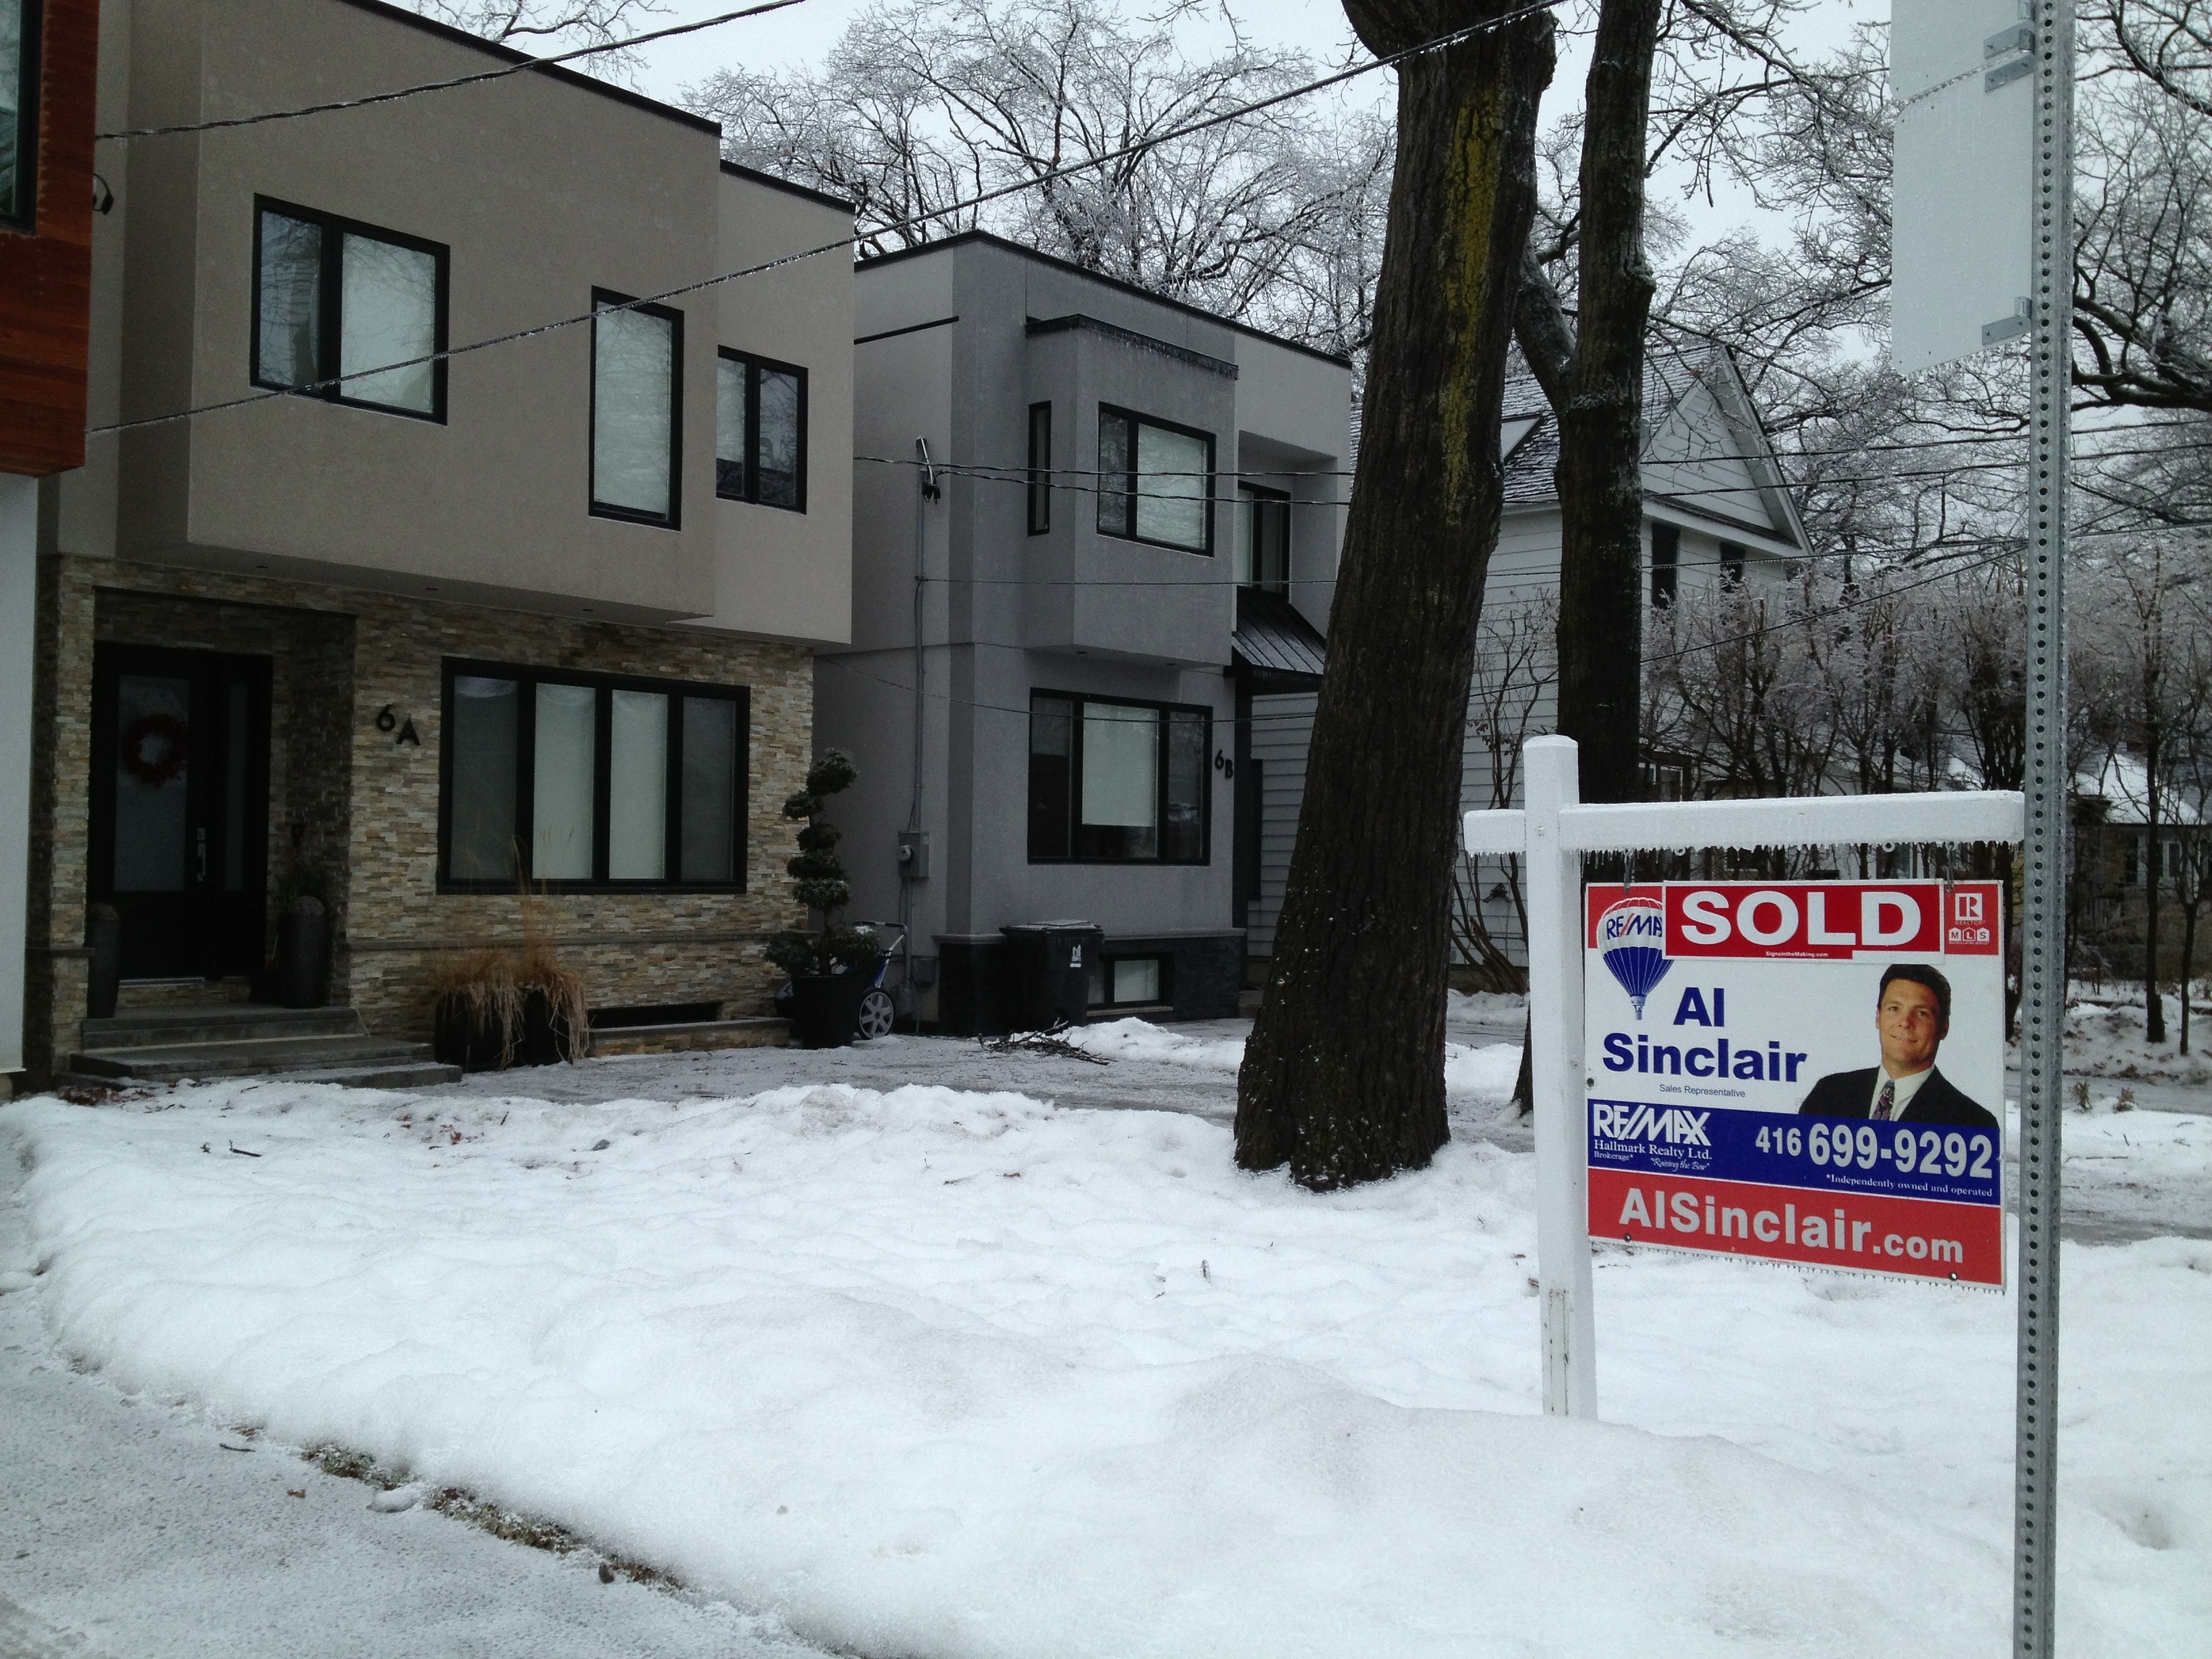
Birchcliff homes that showed well and were accurately priced sold quicker and at a higher price driven by competing multiple offers from buyers.
Let’s look at our November numbers:
Birchcliff – Cliffside Home Sales in November 2013 – 30 homes sold
Source: Toronto Real Estate Board. Excludes commercial properties, condos and vacant land.
Birchcliff/Cliffside
- November 2012 we had 27 homes sold while November of this year 30 homes changed hands – a 9% increase
- November 2012 the average sold price was $559,622 while November 2013 the average sold price came in at $640,860 – an increase of 14.5%
- November 2012 it took on average 23 days and in November 2013 it took 23 days as well.
Toronto Real Estate Board
- 6,391 sales in November 2012 with November 2013 showing 5,613 sales – Up by 13.9%
- $484,208 average selling price November 2012 with November 2013 coming in at $538,881– Up by 11.3%
- November 2012 it took an average of 30 days to sell a home where November of this year 29 days
December
Birchcliff – Cliffside Home Sales in December 2013 – 17 homes sold
Source: Toronto Real Estate Board. Excludes commercial properties, condos and vacant land.
Birchcliff/Cliffside
- December 2012 we had 11 homes sold while December of this year 17 homes changed hands – a 55% increase (No homes sold after the hydro outage)
- December 2012 the average sold price was $491,355 while December 2013 the average sold price came in at $541,441 – an increase of 10%
- December 2012 it took on average 31 days and in December 2013 it took 36 days – 5 days longer to sell.
Toronto Real Estate Board
- 3,582 sales in December 2012 with December 2013 showing 4,078 sales – Up by 13.9%
- $477,756 average selling price December 2012 with December 2013 coming in at $520,398 – Up by 8.9%
- December 2012 it took an average of 35 days to sell a home where December of this year 33 days
According to the Toronto Real Estate Board, our local housing market is defined as Birch Cliff/Cliffside and the boundaries can be seen below.
View Birch Cliff / Cliffside in a larger map