By Hedy Korbee
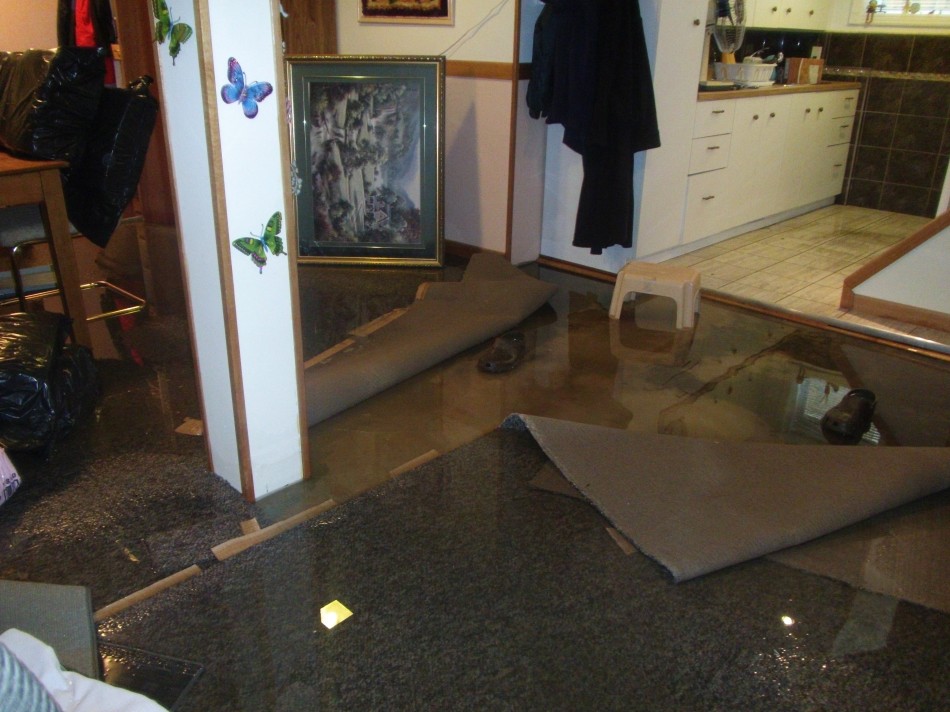
Here’s a map of the extent of flooding in Birch Cliff and the rest of Ward 36, based on information provided by the office of Councillor Gary Crawford.

Map Thumbnail
Scroll down to the map below (not on the right) and take a look.
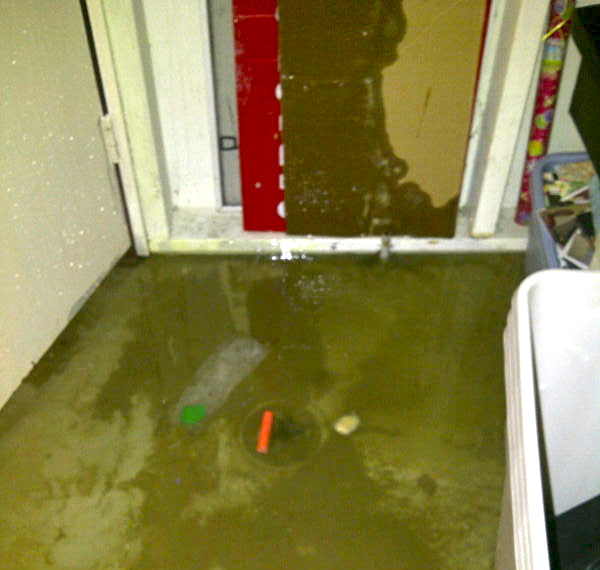
There were reports of flooding on 49 different streets in Ward 36 after the storms on July 15th and August 10th. (Updated at 11:20am to include 8 more streets, up to 49 from 41)
Councillor Crawford’s office estimates that between their office and Toronto 311, approximately 345 calls were received about flooding in Ward 36, but some of them were repeat calls.
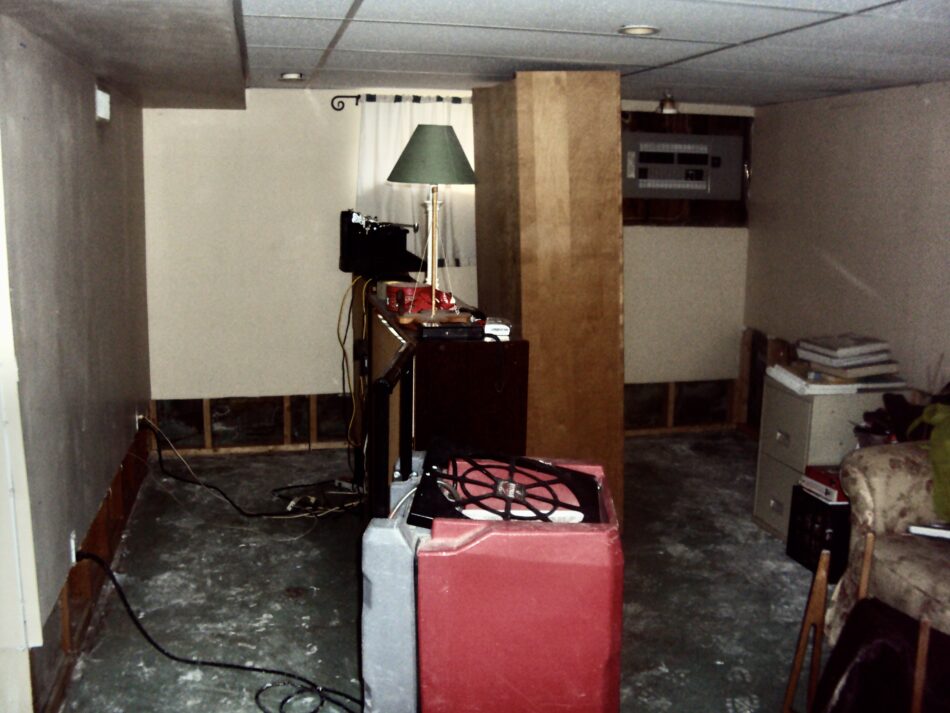
Each place marker on this map represents a street where flooding was reported to Crawford’s office. The markers do not represent individual homes because we were not given that information.
The red markers indicate that more than five houses flooded on that particular street. The blue markers indicate fewer than five houses flooded. (Updated 12:20pm)
I encourage everyone to click on “View on a larger map”, scroll around and zoom in because the map provides important context.
In terms of the number of streets flooded it is clear the hardest hit areas, in order, were Birch Cliff (18 streets), Chine Drive north (13 streets) and Birchcliff Heights (5 streets). It’s interesting, however, to see how concentrated the flooding is on Chine north, compared to Birch Cliff, where it’s more spread out.
If your street flooded and it’s not on the map and you want us to add it, you can scroll down and hit reply or go to the Contact Us page.
View Southwest Scarborough Flooding July/Aug. 201 in a larger map


One thought on “Basement Flooding Map”
Comments are closed.