 By Michael McCann
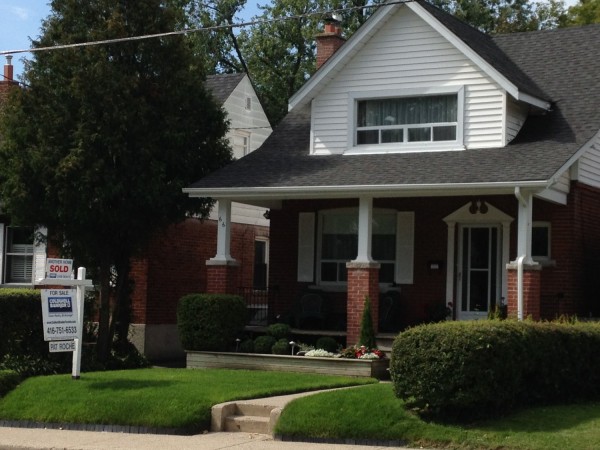
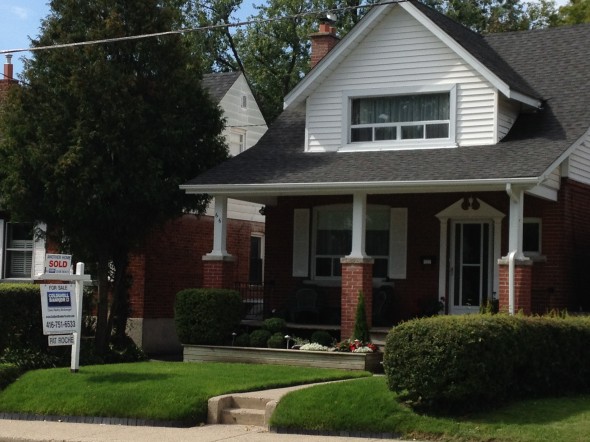
One of the best parts of summer in Birchcliff is having front porch chats with neighbours.
It was in just such a place, on a beautiful sunny morning in July, that the editor of Birch Cliff News and I decided to combine our housing statistics for June, July and August. Summer is short and the last thing on our minds was real estate stats.
June
The month of June came on the tail end of the typically active spring housing market. What you will saw is buyers and sellers looking to firm up a deal prior to the taking a summer hiatus.
From what I see in the statistics, and from my experience with my clients, June’s housing market continued its bullish momentum. Homes in our neighbourhood, which were priced at market value and showed well, attracted a frenzy of activity, eliciting multiple offers and selling quickly. Now this was great for those selling, however not so for those looking to buy.
Birchcliff housing prices continue to be very strong. Our housing prices continue to surpass the Toronto Real Estate Board’s average monthly price. As I have stated previously, our robust housing values are primarily driven by our proximity to the City as well as our predominate housing type being detached.
July
In July, buyer demand did not abate as in previous years. It might have been the cooler weather or continued low interest rates, however on many occasions I found myself competing with five or six other agents in trying to broker a successful sale for my clients.
If you compare average selling price June to July of this year you are looking at a phenomenal increase of almost 7% over month to month. What an excellent return as some Toronto neighbourhoods would see this over year to year.
August
In August we did experience a slow down which was brought on by the shortage of homes for sale. But our housing prices remain robust with year-to-year showing a very healthy increase of a 10.5 percent.
Have a look at our Birchcliff monthly housing statistics yourself:
Birchcliff – Cliffside Home Sales in June 2014 – 36 homes sold
Source: Toronto Real Estate Board. Excludes commercial properties, condos and vacant land.
Birchcliff/Cliffside
- June 2013 we had 23 homes sold while in June 2014 we jumped to 36 homes changing hands – up 57 percent
- June 2013 the average sold price was $601,022 with June 2014 the average sold price came in at $592,847 – a minor drop of a little more than 1 percent
- June 2013 it took on average 18 days and in June 2014 homes in Birchcliff were taking 15 days to sell
Toronto Real Estate Board
- 8,821 sales in June 2013 with June 2014 showing 10,180 sales – up 15.4%
- $529,614 average selling price in June 2013 with June 2014 coming in at $568,953 – up 7.4%
- June 2013 it took an average of 24 days to sell a home where in June 2014 you would be looking at 21 days down 8.3%
Birchcliff – Cliffside Home Sales in July 2014 – 37 homes sold
Source: Toronto Real Estate Board. Excludes commercial properties, condos and vacant land.
Birchcliff/Cliffside
- July 2013 there were 26 homes sold and in July of 2014 there were 28 homes sold – up 8 percent
- In July of 2013 the average sold price was $564,900 and in July of this year the average sold price jumped to $635,439 – up 12.5 percent
- Last July if you were selling your home it took 15 days while in July of 2014 it came in at 13 days
Toronto Real Estate Board
- 8,367 sales in July 2013 and July 2014 showing 9,198 sales – up 9.9%
- $512,286 average selling price in July 2013 with July 2014 selling at $550,700 – up 7.5%
- July last year the average time it took to sell a home was 28 days and in July 2014 it 24 days –down 14.3%
Birchcliff – Cliffside Home Sales in August 2014 – 23 homes sold
Birchcliff/Cliffside
- August 2013 there were 28 homes sold and in August of 2014 there were 23 homes sold – down 1 8 percent
- In August of 2013 the average sold price was $545,572 and in August of this year the average sold price jumped to $602,743 – up 10.5 percent
- Last August if you were selling your home it took 18 days while in August of 2014 it came in at 16 days
Toronto Real Estate Board
- 7,391 sales in August 2013 and August 2014 showing 7,600 sales – up 2.8%
- $501,677 average selling price in August 2013 with August 2014 selling at $546,303 – up 8.9%
- August last year the average time it took to sell a home was 29 days and in August 2014 it was 27 days –down 6.9%
I see September fueling itself right backup as we all embark on another wild housing wave.
Over the next six weeks we will see more realtor signs popping up on lawns and buyers will be anxious to secure a deal in what will be a busy fall real estate market.
For a look at house prices over the previous few months, click on the tabs below.
[tabs slidertype=”top tabs”] [tabcontainer] [tabtext]May[/tabtext] [tabtext]April[/tabtext] [tabtext]March[/tabtext] [tabtext]February[/tabtext] [/tabcontainer] [tabcontent] [tab]Birchcliff – Cliffside Home Sales in May 2014 – 43 homes sold [/tab] [tab]Birchcliff – Cliffside Home Sales in April 2014 – 37 homes sold [/tab] [tab]Birchcliff – Cliffside Home Sales in March 2014 – 42 homes sold [/tab] [tab]Birchcliff – Cliffside Home Sales in Feb. 2014 – 23 homes sold [/tab] [/tabcontent] [/tabs]
According to the Toronto Real Estate Board, our local housing market is defined as Birch Cliff/Cliffside and the boundaries can be seen below.
View Birch Cliff / Cliffside in a larger map
Related Posts

Cliffside tenants fight for their homes
Tenants in three low-rise apartment buildings on Glen Everest Road are fighting to save their homes from a developer who plans to tear down their affordable rental buildings and replace them with a new 12-storey condominium.

$300 million sewer upgrades recommended
More than 100 streets in Birch Cliff, Cliffside and Cliffcrest have been targeted for $300 million in recommended infrastructure upgrades by the City of Toronto to reduce the risk of flooding through sewer overflows.

2019 historical calendars

Calendars celebrate Bluffs history

Impressive Cliffside clean-up

Buyers adopting new tactics

House prices: Is the sky falling?

From farmland to suburbia

Birch Cliff is changing

Mailbox wars

Hammer Time part two
